Sample Trading Strategy Test
Here we’d like to provide an example of a stock trading strategy test. This will demonstrate you capabilities of our system and help you understand what kind of information you will receive in the strategy test report.
The trading strategy used in this example is based on Bollinger Bands ®. This is a tool invented by John Bollinger in the 1980s. Bollinger Bands ® consist of:
- An N-period simple moving average (MA). In this example N=20
- An upper band is MA plus K standard deviations (MA+K*σ). In this example K=2.7
- An upper band is MA minus K standard deviations (MA-K*σ).
Trading Strategy Test Description
We used 1 minute candlestick time period, but you can choose any (above 1 minute).
Go long when:
- Previous candle closing is below 2.7 Bollinger Band, and
- RSI (14) is below 20, and
- Standard deviation for last 20 minutes is more than 0.05, and
- Current price is less than 1% higher than day low. Obviously, not full day low, but the lowest price in the day before current moment.
We don’t sell short in this strategy.
Target price: We set the target price at four standard deviations above the current price, but not higher than 0.4% from current price.
Stop loss is mirrored down from the target price relative to the current price. We set the stop loss at four standard deviations below the current price, but not lower than -0.4% from current price.
Back testing period: May 11 2015 – May 5 2017
Transaction fee: $4.95
Symbols: S&P 500
Include Monte Carlo Simulation
Include charts for each trade into report. In addition to the candlestick chart, we’d like to see the RSI (14) and MACD (12,26,9) charts for each trade (yes, we can do custom charts for you)
Initial Capital: $25,000
Testing of such strategy would cost about $140. Cost is defined individually based on complexity of your strategy.
Strategy test results
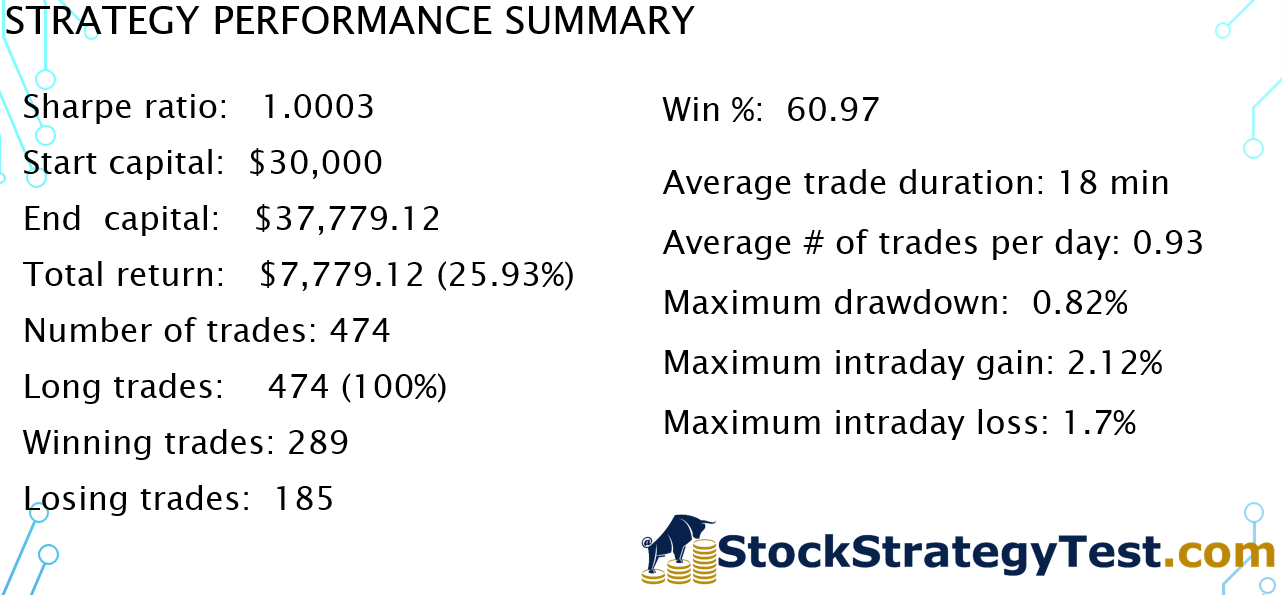
Statistics
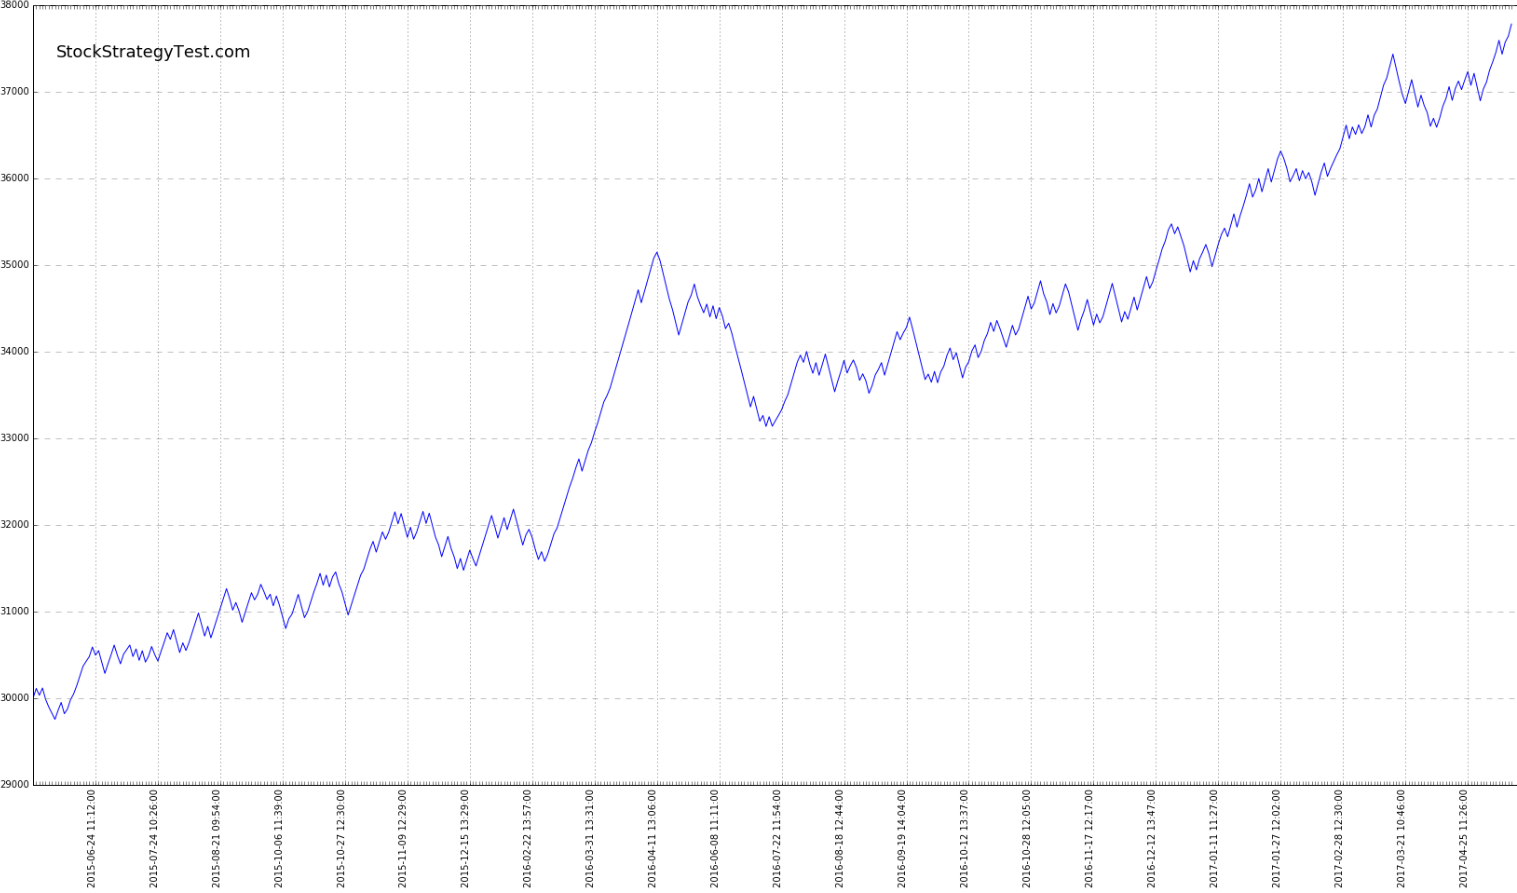
Equity curve:
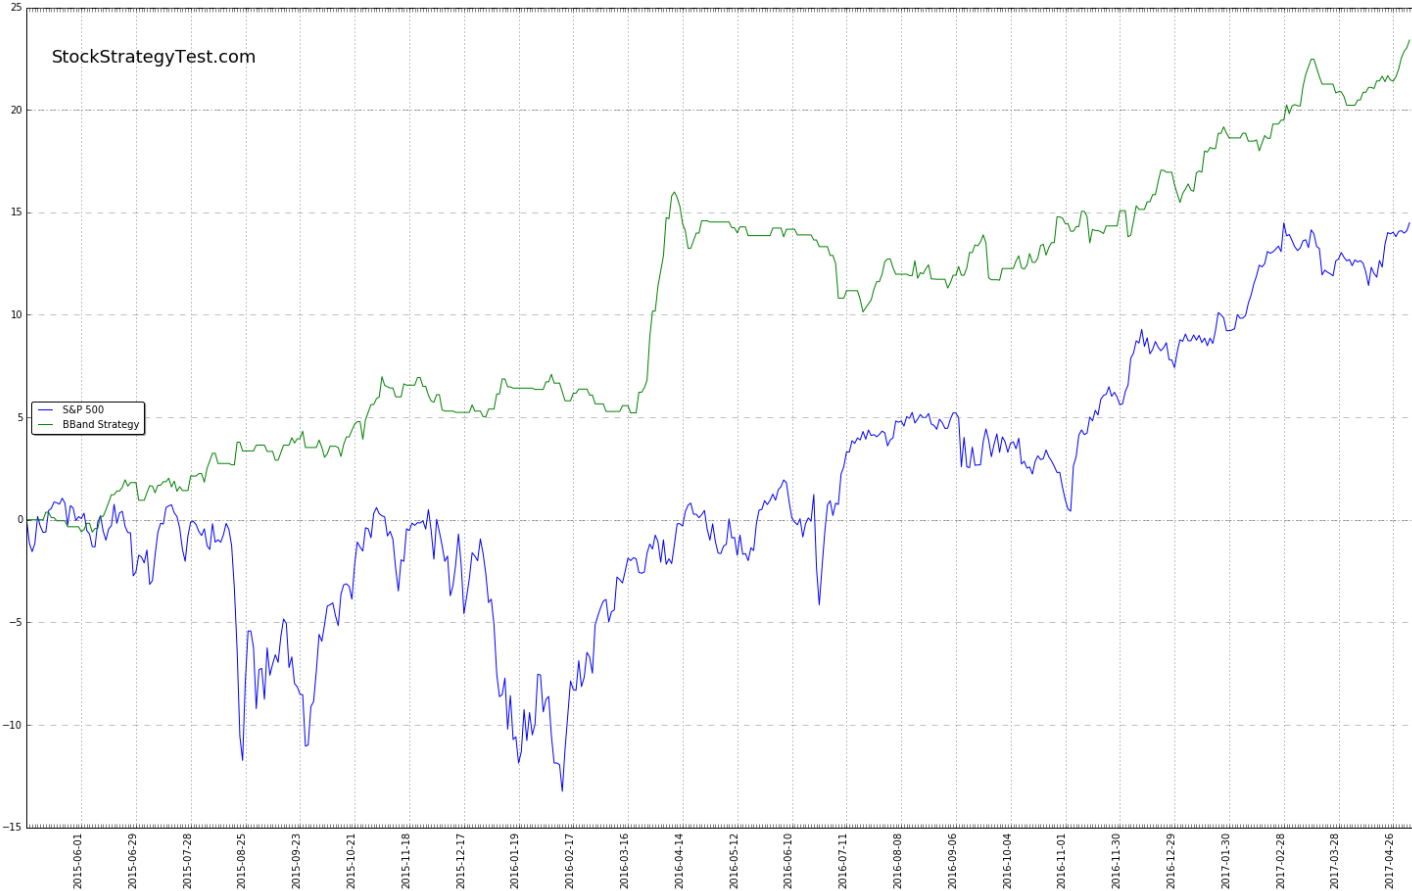
Comparison with S&P500
Trade Charts
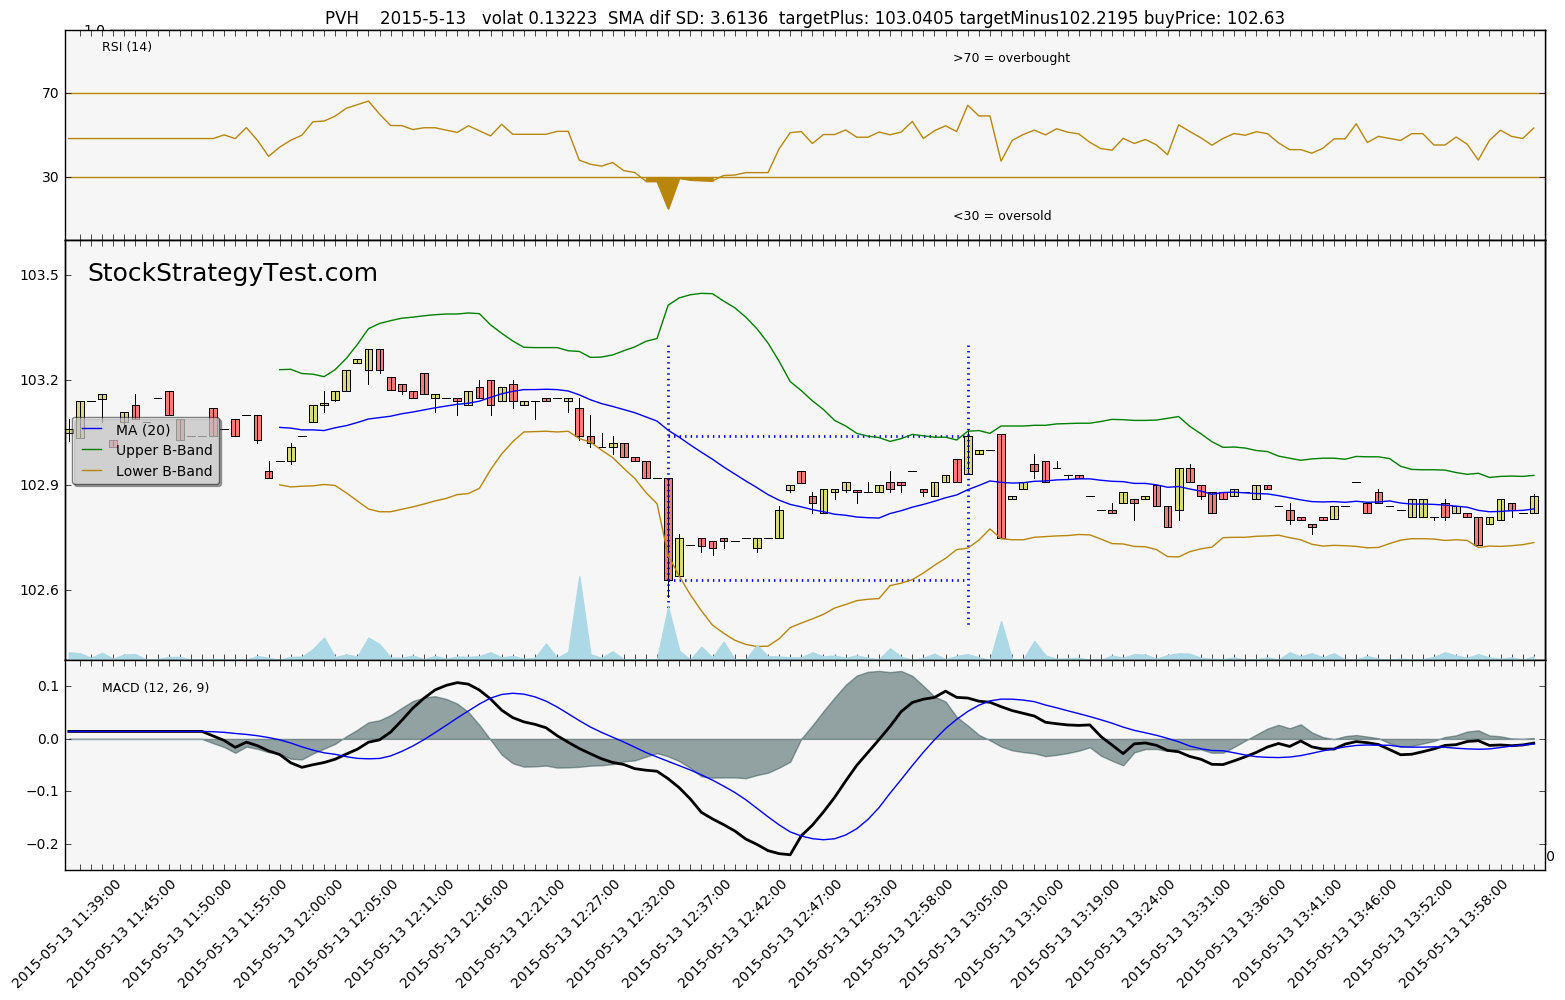
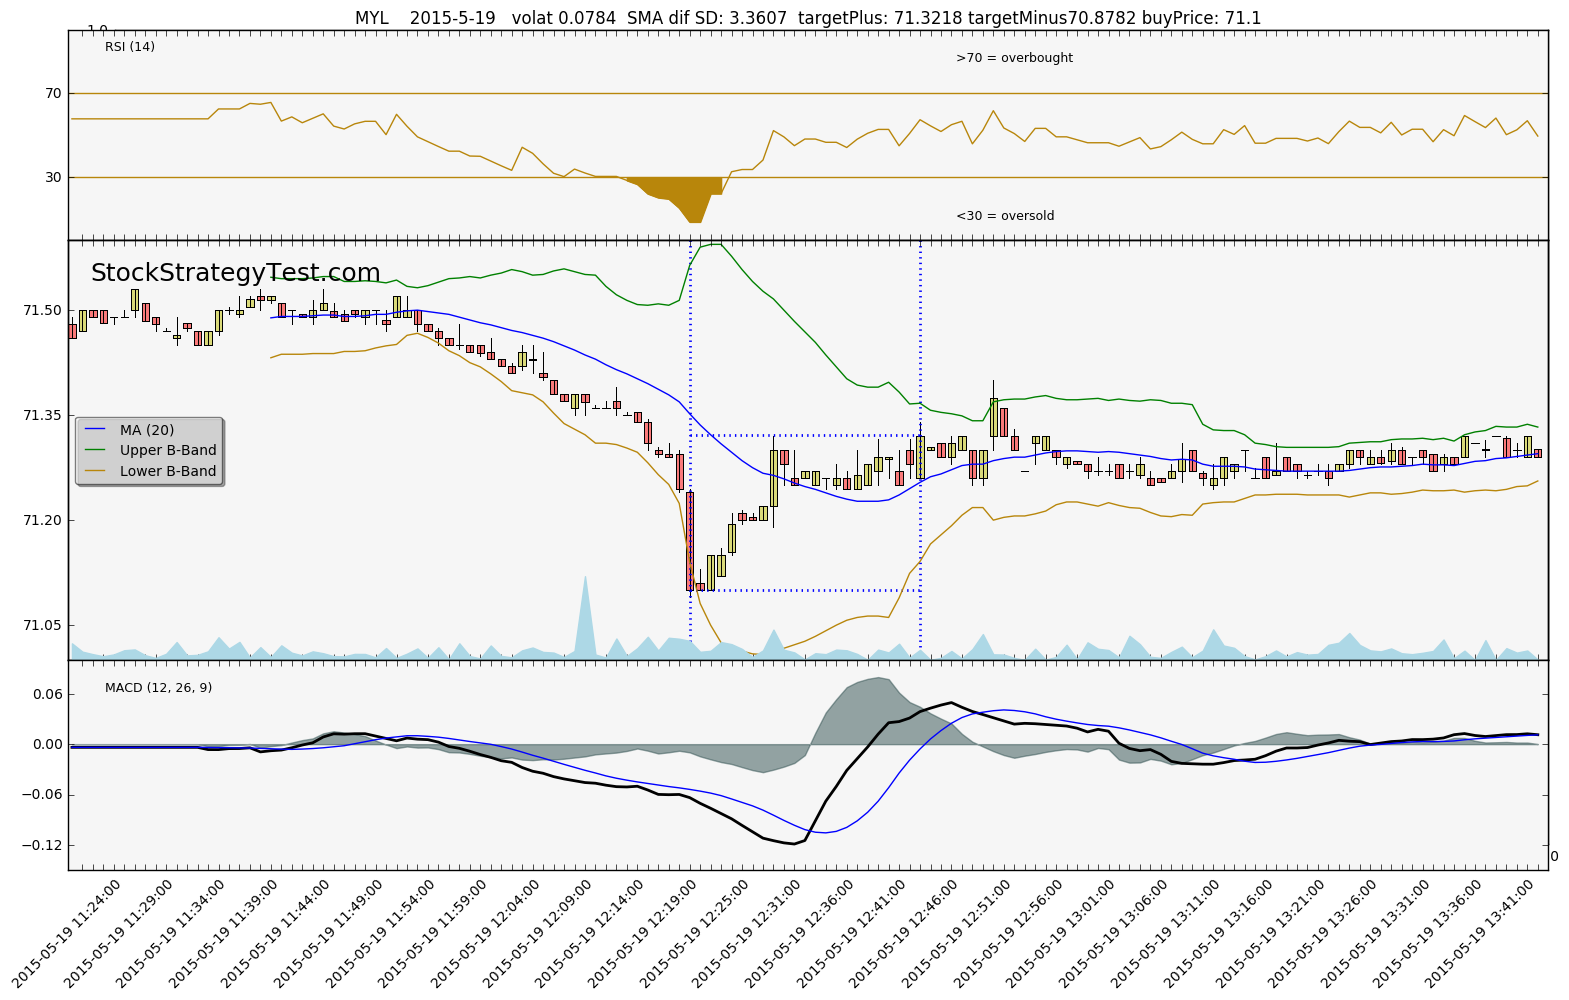
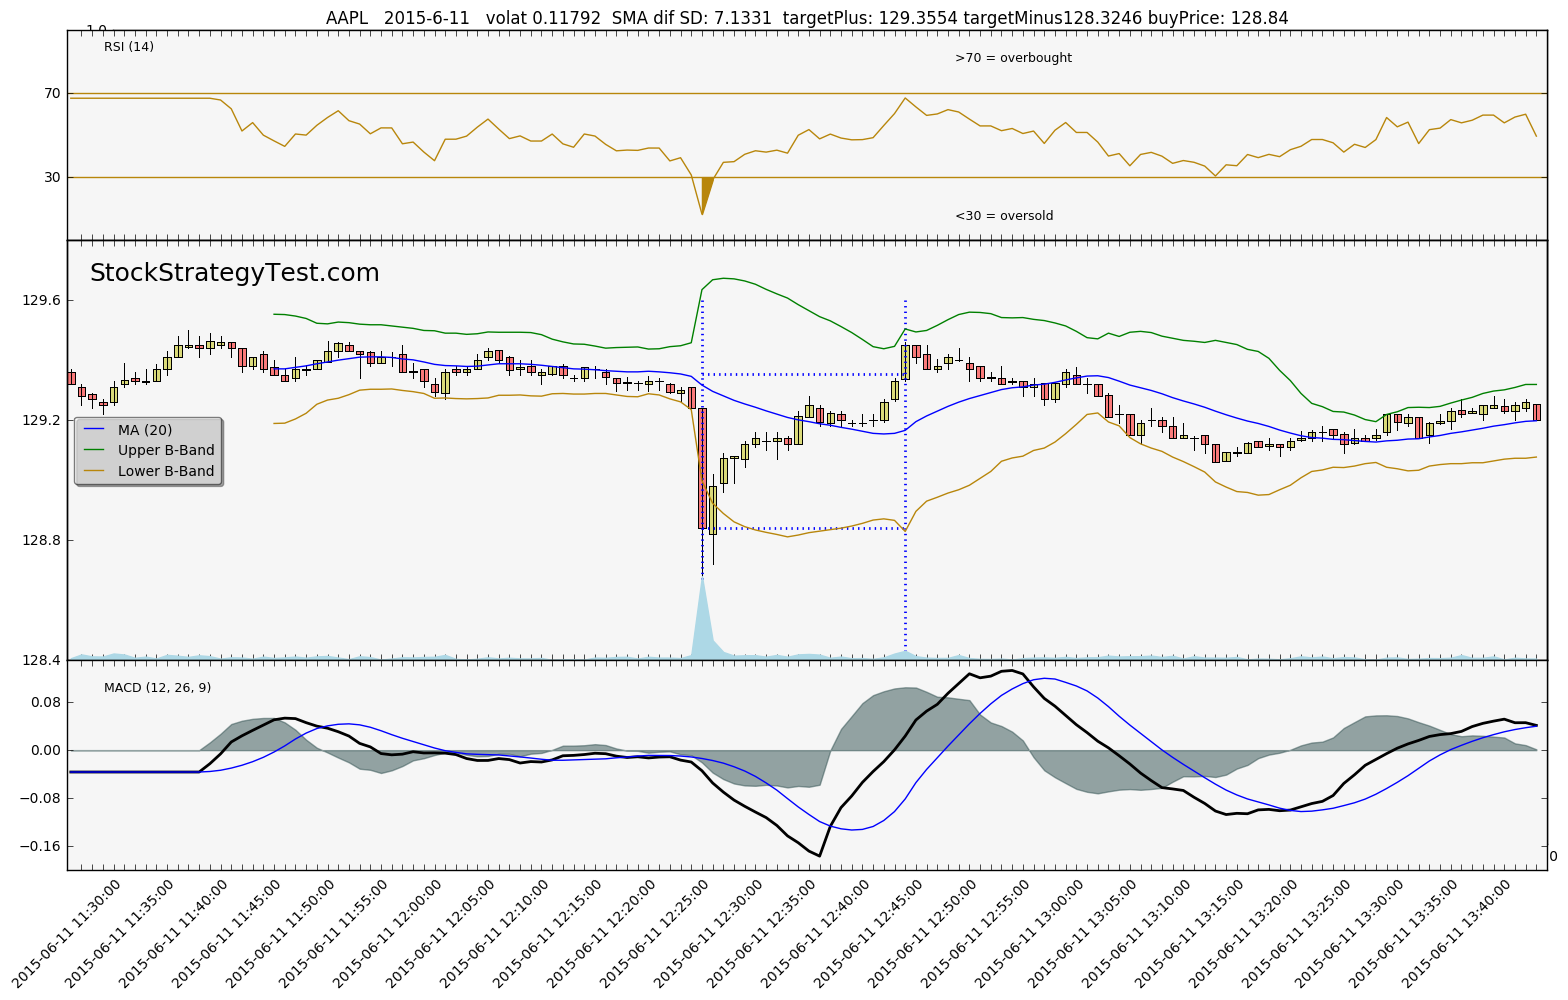
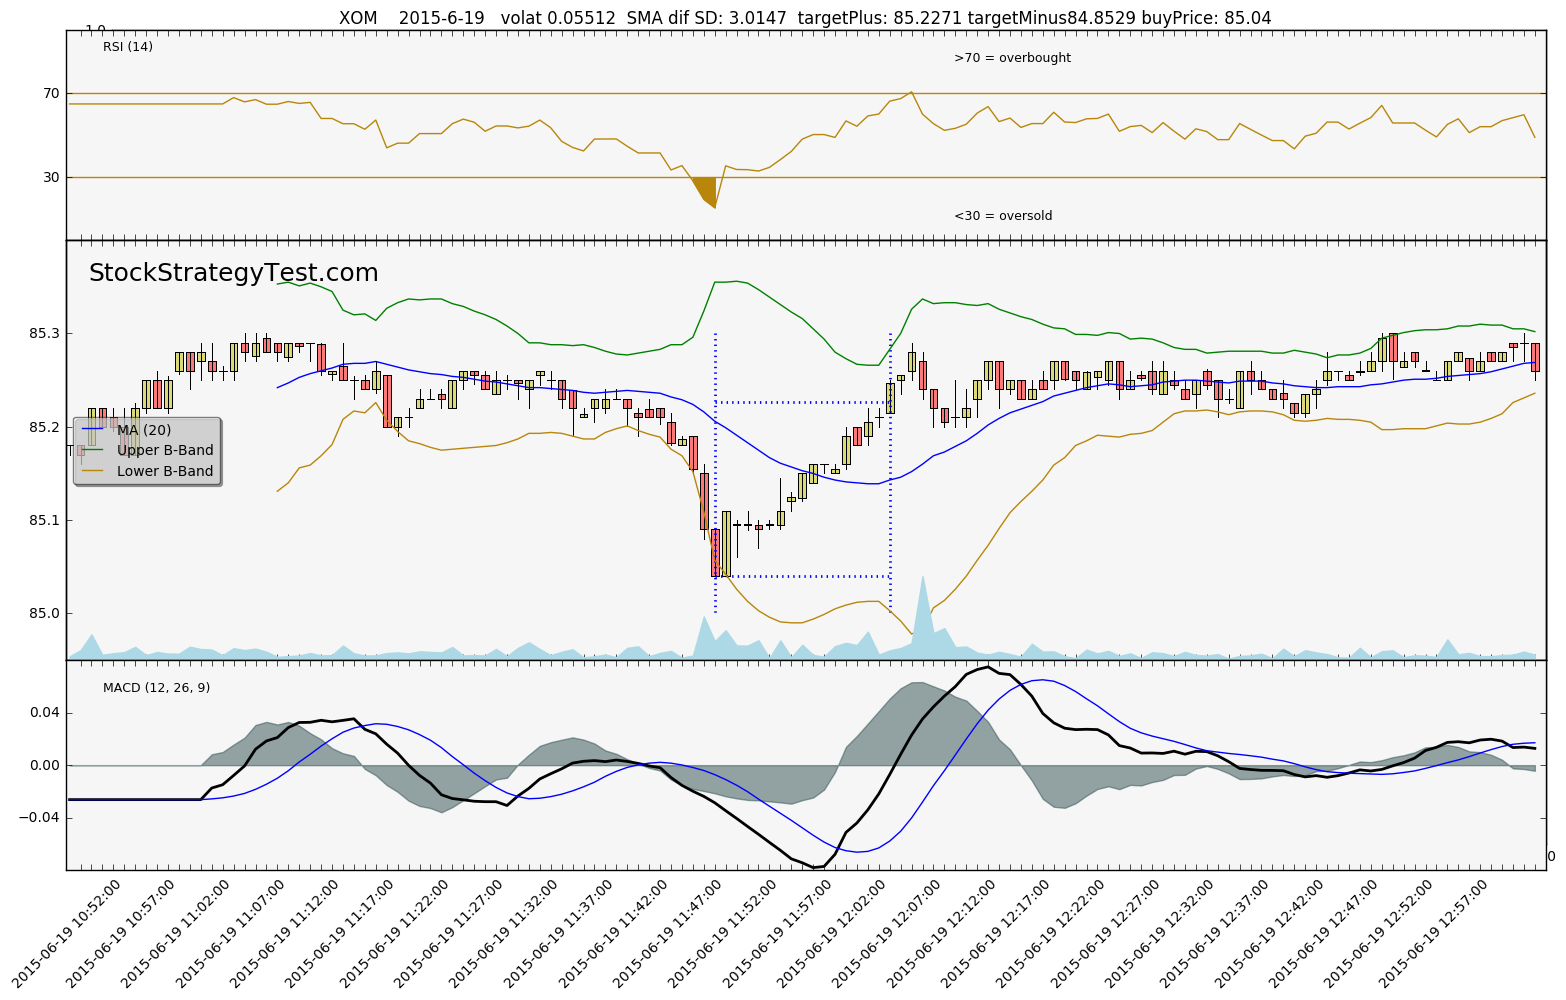
Here are few samples of individual trades’ charts. When you order your trading strategy test, you may request any type of customization on your chart. If you choose so, you will receive hundreds of charts (one per each trade). You’ll be able to analyze wide variety of market situation and further improve your strategy.
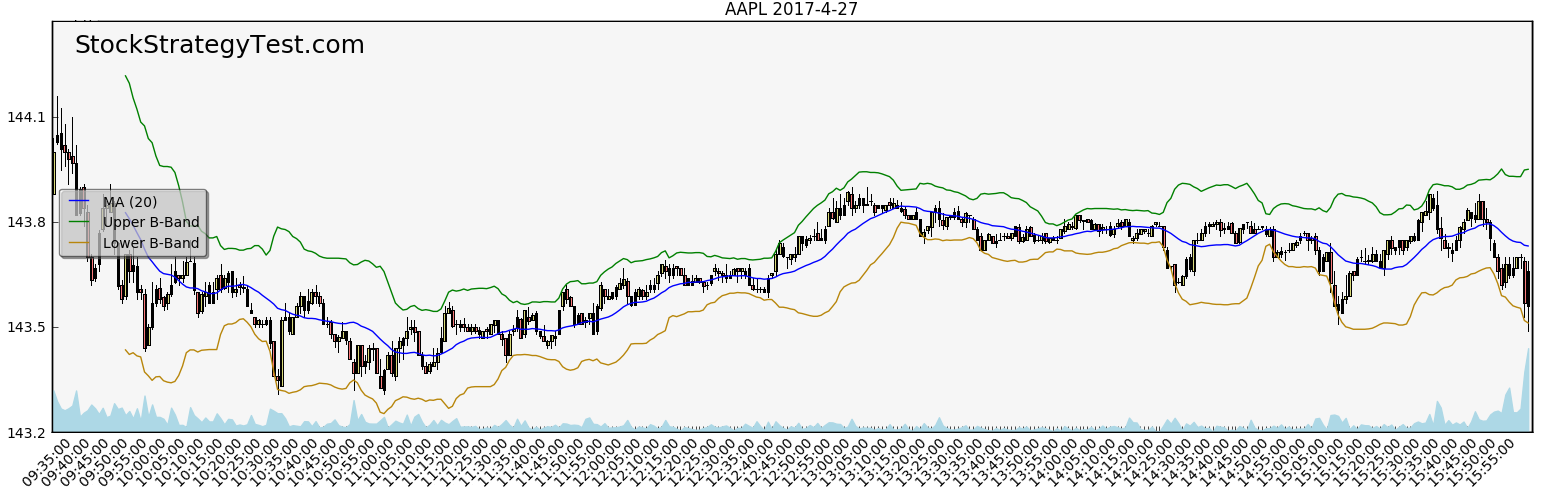
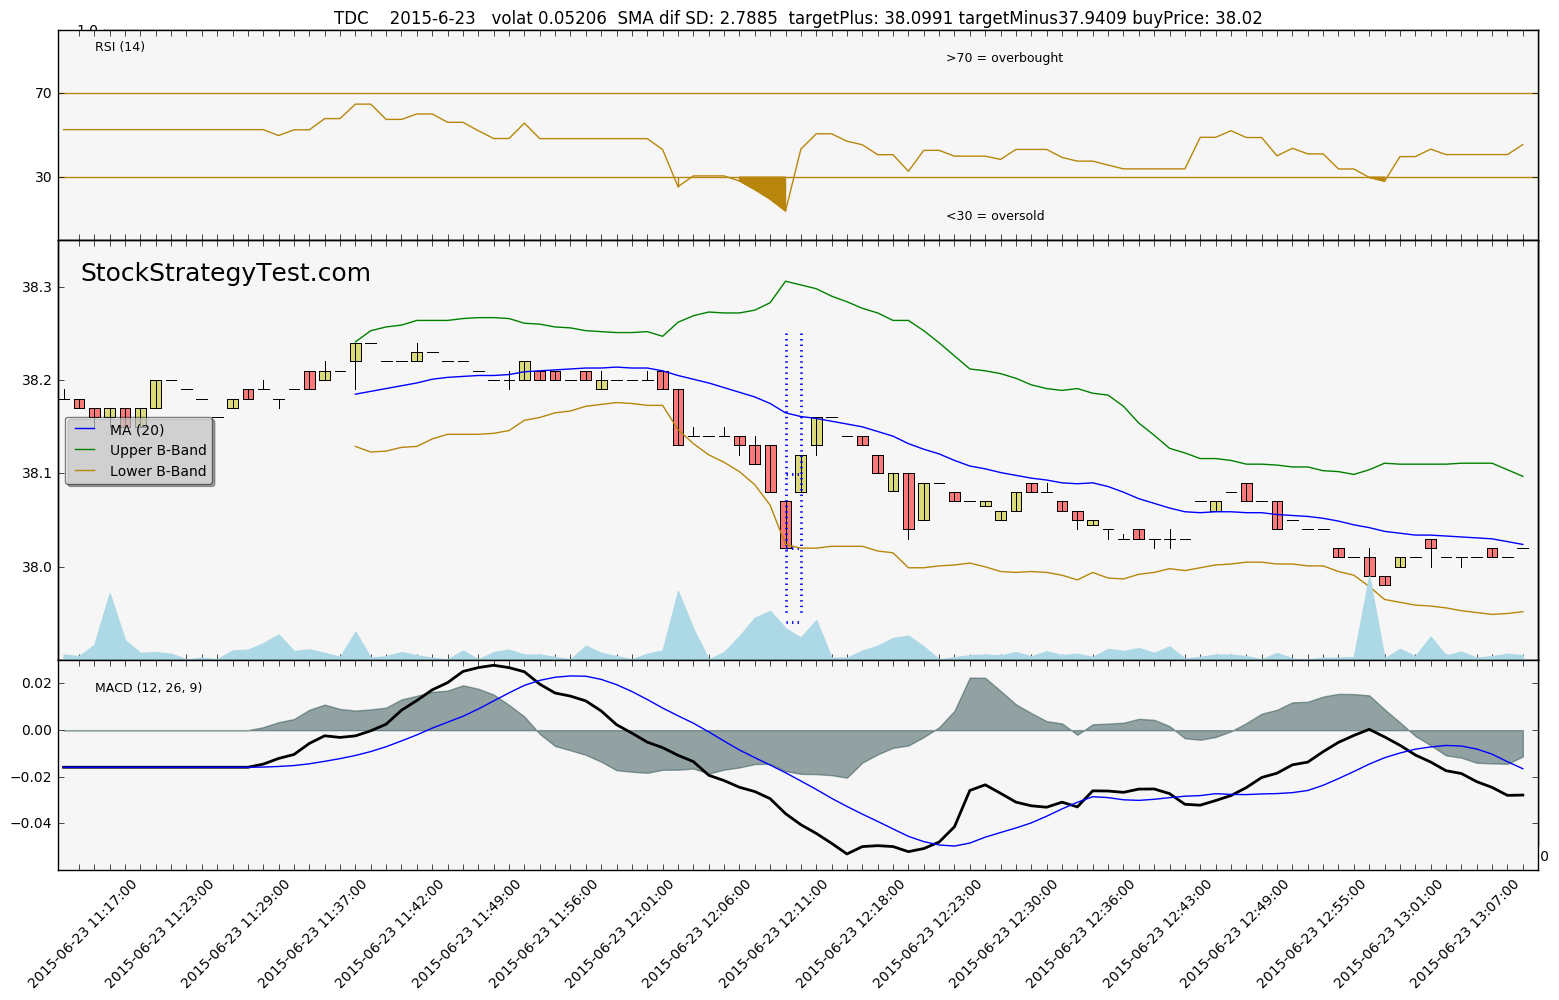
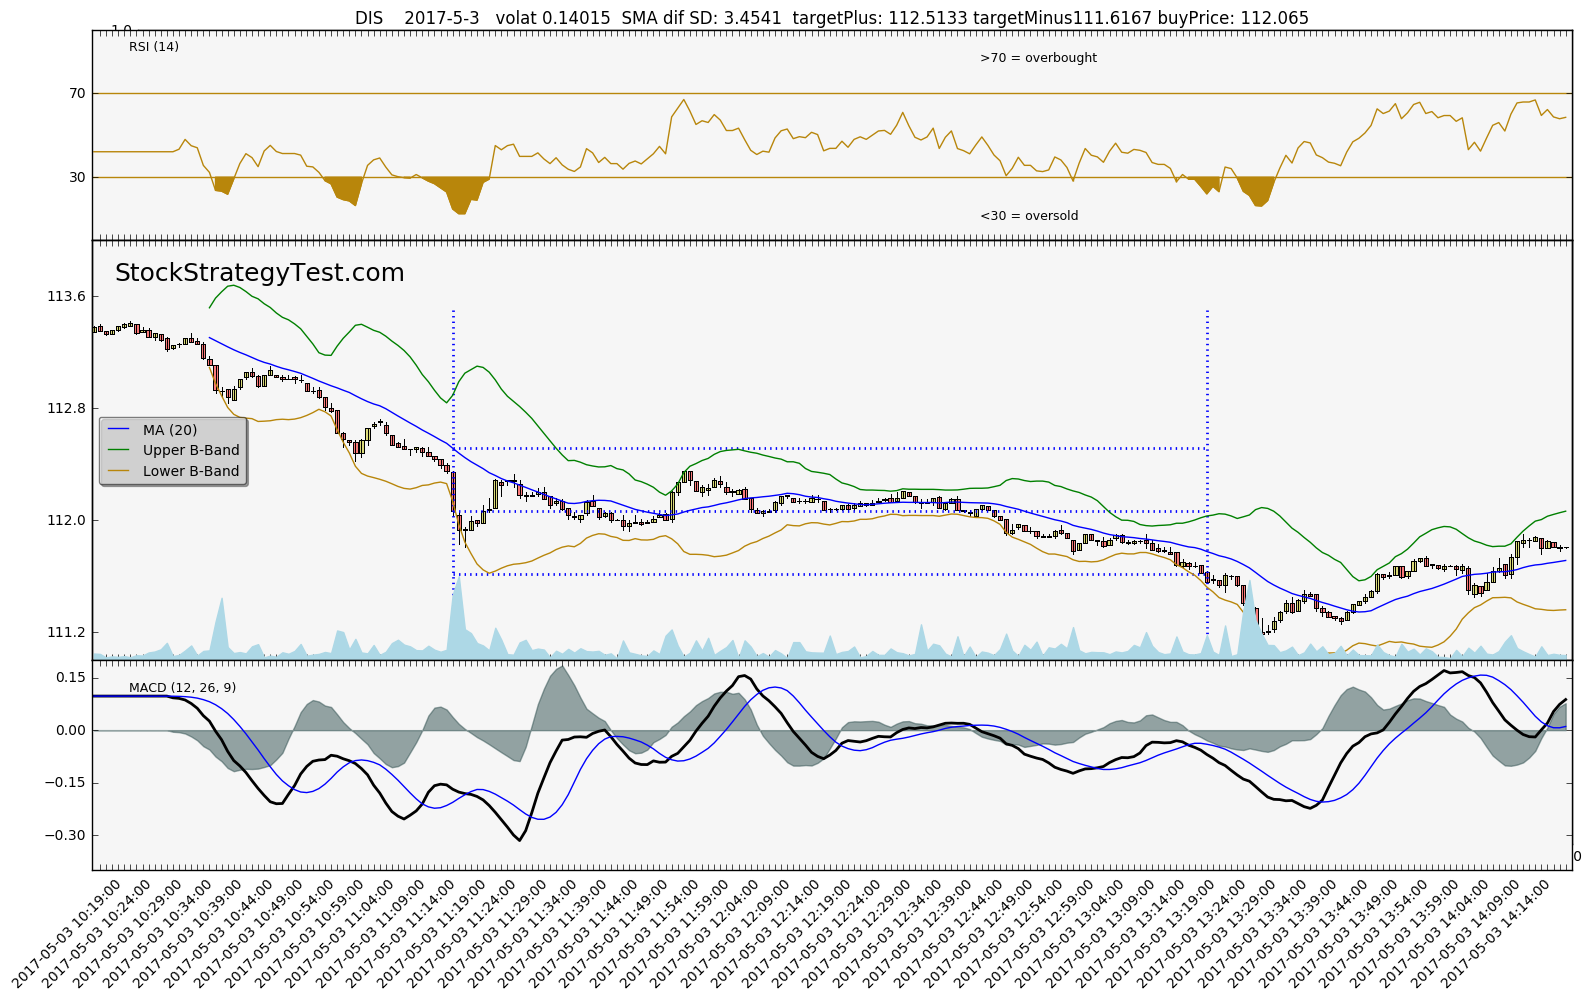
On these plots you can see:
- Candlestick chart for a specific symbol
- Simple moving average for past 20 intervals
- Bollinger band ranges (2.7 standard deviations from MA)
- Trade parameters: entry time, exit time, entry price, target price, stop loss price.
- RSI (14) – Relative Strength Index
- MACD (12,26,9) – Moving average convergence divergence. MACD is not used in the strategy parameters, however we added this parameter for the future visual analysis.
- Symbol and other parameters of the trade on the top of the chart
For this example, system generated 474 charts – one per trade. Here are some of them:

Monte Carlo simulation results
Monte Carlo simulation is a powerful tool of statistical analysis. You can read more about it here.
In this trading strategy test example, we used the following inputs for the Monte Carlo simulation:
- Number of scenarios: 1,000
- Number of trades per scenario: 474 (number from the original test above)
- “Stop” amount: 25,000. This is amount when we stop trading the strategy. It is interesting to see what is the probability of achieving this “stop-loss” for the strategy. Remember, our initial amount is 30,000
The outputs of the Monte-Carlo Simulation:
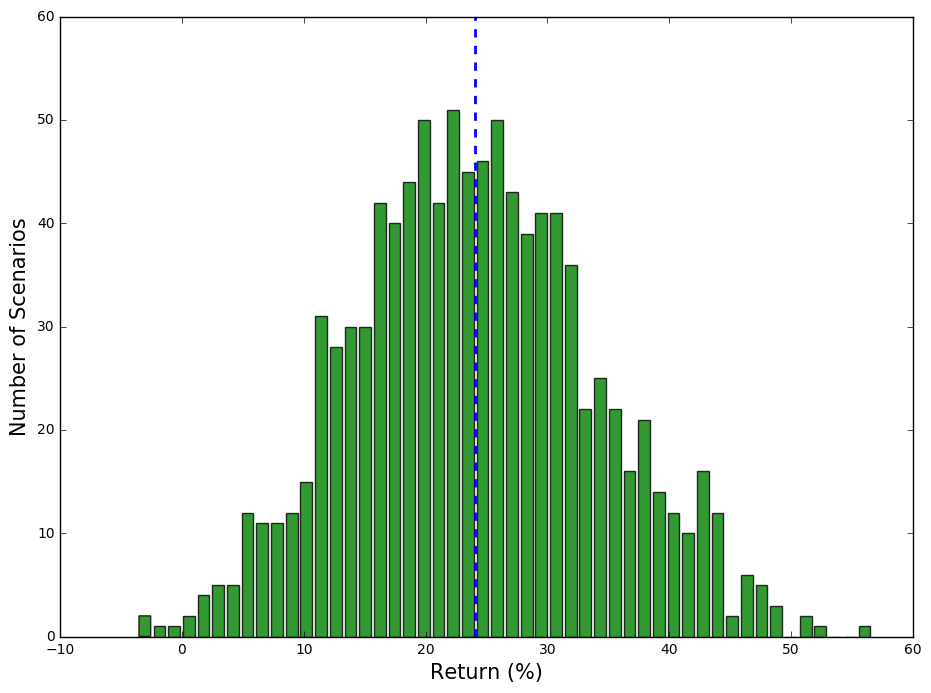
- Average return: 24.06%
- Average maximum drawdown: 1.26%
- Return to drawdown ratio: 19.16
- Number of times account was ruined (minimum balance achieved): 0. Zero percent probability (based on two years historical data) to ruin your account with this strategy. However, it doesn’t mean it is impossible in the future.
- Only 4 scenarios gave us negative return. Which means there is 99.6% chance to get positive return with this strategy.
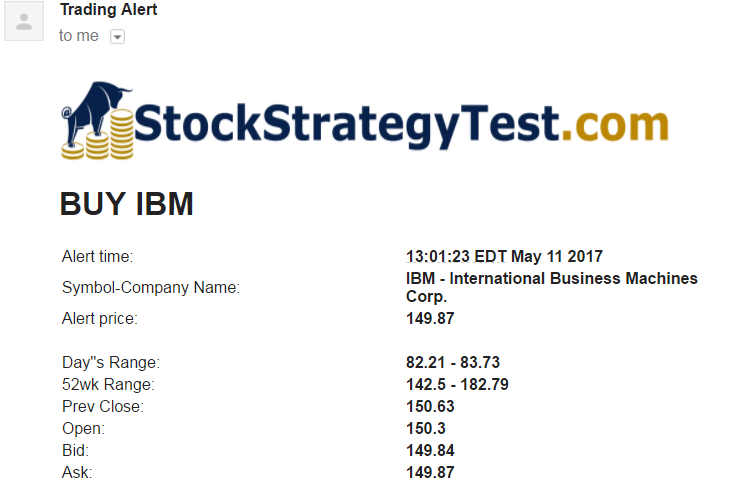
Live trading alerts
We can set up our system to track the stock market form you and inform you when criteria you defined are met. We can customize the content of the alerts for you.
If you have any questions, please contact us or leave us a comment below