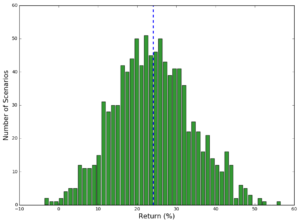
 Based on historical performance of your trading strategy, you can build an equity curve. It’s a great way to visualize your strategy’s performance. But what if the order of trades was different? How would it impact your equity curve? Could your drawdown be more severe? These are the questions Monte Carlo simulation can answer.
In a simple form, Monte Carlo simulation can be explained as following: First, get a number of little pieces of paper, one for each trade in your strategy. Then, write down one trade result on each piece of paper and put all the pieces in a hat. Choose one piece randomly. That is your first trade. Record it, adding it to your initial equity, and then put the piece of paper back in the hat. Then, pick another piece of paper, record its value, and add it to the existing equity curve you are building. If you repeat this for a number of trades, you’ll get a possible equity curve. If you do the whole analysis many, many times, you’ll have a family of equity curves. Each of them will represent a possible scenario or sequence of your trades.
Using the family of possible curves, you can get statistics about your trading system. These statistics can help you evaluate a strategy, determine a position sizing approach, and give you realistic scenarios for what you might face if you actually trade the strategy live. Of course, this all assumes that the historically derived trades will be the same as the trades in the future. If your historical trades are based on flawed development, future results will be garbage.
Monte Carlo simulation is particularly helpful in estimating the maximum peak-to-valley drawdown. To the extent that drawdown is a useful measure of risk, improving the calculation of the drawdown will make it possible to better evaluate a trading system or method. Although we can’t predict how the market will differ tomorrow from what we’ve seen in the past, we do know it will be different. If we calculate the maximum drawdown based on the historical sequence of trades, we’re basing our calculations on a sequence of trades we know won’t be repeated exactly. Even if the distribution of trades (in the statistical sense) is the same in the future, the sequence of those trades is largely a matter of chance.
Obviously, there are some potentially serious drawbacks to this analysis. First, the analysis assumes that the trades in your performance report are the only possible trades that can happen. This is obviously false, since when you start trading live, any result is possible for a particular trade. But, if the distribution (overall mean and standard deviation) of the trades is accurate, then the Monte Carlo approach can yield meaningful results.
A second drawback is that this analysis assumes that each trade is independent of the previous trade, a condition commonly referred to as serial or auto correlation. For most trading strategies, this is not an issue. However, if you have a strategy in which the trade results depend on each other, simple Monte Carlo analysis is not appropriate.
Assuming you can live with the drawbacks listed, Monte Carlo can help you answer the following questions:
■ What is my risk of ruin for a given account size?
■ What are the chances of my system’s having a maximum drawdown of X percent?
■ What kind of annual return can I expect from this trading system?
■ Is the risk I am taking to trade this strategy appropriate for the return I am receiving?
You can also read about the Monte Carlo simulation on Investopedia
